Under the Company Report in Farmdesk, you get a comprehensive overview of your technical and economic key figures, broken down into different segments. It is a comprehensive report with many data fields. A faster and more visual report can be found under the Performance Indicators.
All the key figures are calculated from the automatic milk collections and the feed lists. For correct results, it is important to regularly:
- the feedlists update
- the cost of purchased feeds adjust
- the right animal numbers enter
The above things can be done easily and quickly via the Farmdesk app!
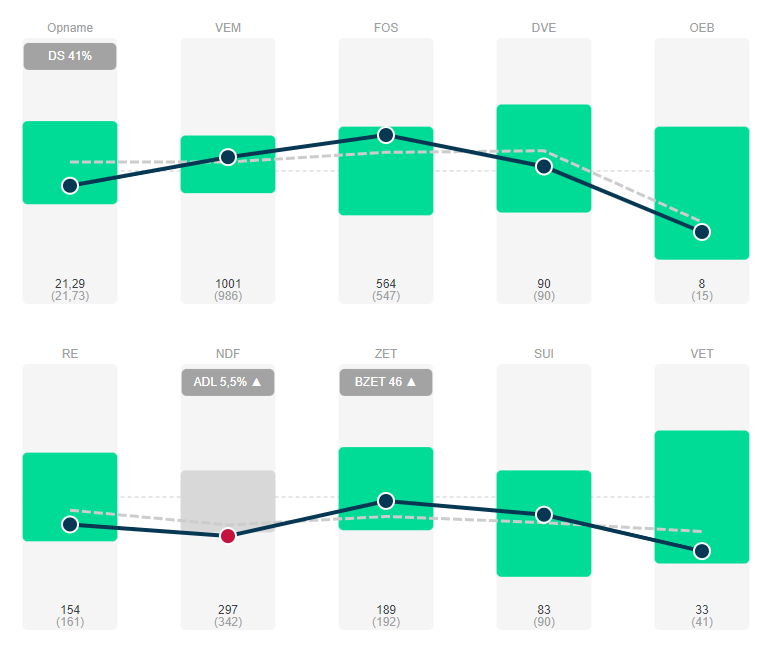
"Your grade" gives the value for each key number in the selected month. Right behind it is "(Rolling Year)," which is your rolling year average.
In addition, the columns "FD-mid" and "FD-top" are displayed. Through these values you can compare your own figure with the other Farmdesk users. In this comparison, we use as measure the feed profit at equal milk price. This key figure is the best indicator of overall techno-economic performance. Assuming an equal milk price eliminates the effect of different milk prices among dairy collectors.
Example: the feed efficiency for FD-mid and FD-top for a given month are 1.41 em 1.52. This means that the 25% best cattle farmers in terms of feed profit at the same milk price, have on average a feed efficiency of 1.52. And that the middle group on average has a feed efficiency of 1.41.