Feed Values
A ruminant needs energy, protein and structure for its milk production, growth, gestation and body maintenance. The effective need is calculated as a function of body weight, age, days in lactation, milk yield, and fat and protein content.
For a ration, the content of energy and protein can be calculated, and then one can compare this to the theoretical requirement.
However, the ruminant does not do math. Therefore, it is very important to notice the animal signals (milk yields, condition, manure, behavior), evaluate them, and adjust the theoretical ration based on this basis.
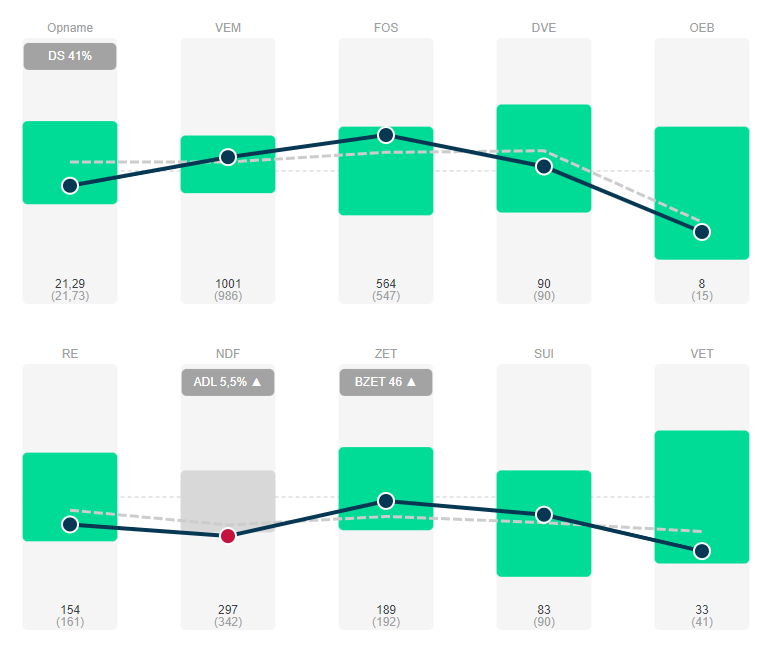
A ration consists of feedstuffs. For each feed material, "hard" key figures can be effectively measured in the lab. These are DS (dry matter), RE (crude protein), RC (crude fiber), NDF, ADL, ZET (starch), BZET (resistant starch), SUI (sugar) and VET - see below for more details. Based on these measurements, the parameters VEM, FOS, DVE and OEB can be calculated.
Additional reading: Protein digestion in cattle and Energy digestion in cattle
Calculated key figures
- Input [kg DS] The total intake of the ration should be sufficient, but on the other hand it is also limited. Only the intake depends on the total amount of feed, the other parameters give a density.
- VEM[/kg DS] The Feed Unit Milk is a measure of total energy requirements (milk production, growth, gestation and maintenance). Like the other parameters below, it is evaluated per kilogram of dry matter, i.e., as a density.
- FOS [g/kg DS] Fermentable Organic Matter is a measure of pens energy. It is the amount of organic matter available in the rumen for rumen microbes.
- DVE [g/kg DS] Intestinal Digestible Protein is the protein that is digested in the thin intestine. It is important for milk protein and it pushes for milk production. It comes from two sources: one is protein formed in the rumen (microbial protein), and the other is plant protein that passes untouched from the rumen to the intestine (resistant protein).
- OEB [g/kg DS] The Unstable Protein Balance is a balance between the available protein on the one hand and the available energy for the pens microbe on the other. In theory it should be zero, in practice the value may be higher to push for milk production. Too high an OEB leads to ureum excess in the blood and milk, which can cause liver strain.
Hard key figures
- DS The DryStuff percentage indicates how humid the ration is. The rate of digestion of cell walls, starch or protein can be greatly affected by the moisture of the ration.
- RE [g/kg DS] Share Rough Protein. Proteins can vary considerably in the rate at which they are broken down in the rumen. Rapidly degradable is the unresistant portion, slowly degradable is the resistant portion. RE supply is important for milk production and milk protein formation, provided it is combined with sufficient energy.
- RC[/kg DS] The Red Cellulose is a component of the cell wall carbohydrates. Depending on the shedding of the plant, it can be highly or less digestible. The less digestible, the more structural in the rumen. Slowly digestible crude fiber results via acetic acid formation in milk fat.
- NDF [g/kg DS] Neutral Detergent Fibre represents the total weight of cell walls. A cell wall is composed of a middle lamella (contains mainly pectin), a primary cell wall (contains mainly cellulose and hemicellulose) and possibly a secondary cell wall (contains mainly lignin (wood dust) and possibly cutin (cork dust)). Pectins are largely converted to propionic acid to form glucogenic energy while cellulose and hemicellulose are largely converted to acetic acid to form milk fat.</li
- ADL [g/kg DS] The Acid Detergent Lignin is the part of the plant that is completely not digestible. These lignins disappear again via manure. They do have a value, in that lignins provide the feel prick in the ration and, along with cellulose and hemicellulose, give rise to required activity.
- ADL/NDF is a ratio we calculate to estimate how good the digestibility of the cell walls are. A low ADL/NDF ratio corresponds to high NDF digestibility while a high ratio indicates low digestibility.
- SET [g/kg DS] Starch are part of the cellular content carbohydrates. These are easier to digest than the RC. Resistant starch passes through the rumen to the small intestine and can be used directly as an energy source. Unresistant starch can be used as an energy source for rumen microbes (FOS) and/or can be converted to propionic acid in the rumen and then used as an energy source through the liver. Excess of unstable starch can lead to pens acidification via lactic acid formation.
- BZET [g/kg DS] Resistant Starch is the fraction of starch that is unavailable in the rumen and that becomes digestible in the small intestine only after it is enzymatically broken down there into glucose. It thus makes a greater contribution to glucose supply than unstable starch. In the case of too high resistant starch, excess starch enters the thick intestine. In the colon, the starch provides less energy for the cow and can also lead to the formation of unwanted bacteria, such as E. Coli.
- SUI [g/kg DS] Sugars are part of the cellular content carbohydrates. They are highly fast digestible in the pens (FOS). A limited amount of sugar possibly results in additional milk fat via beta-hydroxybutyric acid formation, however, excess can lead to pens acidification via lactic acid formation.
- FAT [g/kg DS] Fats (often also abbreviated as RV), are very energy-rich. Resistant fats pass through the rumen. For non-resistant fats, the allowable amount is limited so as not to interfere with proper pen function.
Techno-economic key figures
- Expected VEM milk is the theoretically expected milk (with indicated contents) possible via total offered energy (VEM) in the ration.
- Expected DVE milk is the theoretically expected milk (with specified contents) possible via total offered protein (DVE) in the ration.
- For a balanced ration, VEM and DVE measuring milk should be close to each other.
- Same as above, but calculated from FPCM with 4.00% fat and 3.33% protein.
- This value gives the theoretical amount of concentrate (in kg concentrate equivalent, i.e. to 89% dry matter) for the production of 100 kg of expected FPCM. Here we use with the minimum of the VEM and DVE expected FPCM.
- By concentrate here we mean moist by-products, single concentrate, compound feed and feed additives.
- This value gives the percentage of all concentrate feed additives to total dry matter intake. This means the sum of moisture by-products, single concentrate feed, compound feed and feed additives.
- In addition, the absolute amount of concentrates in kilograms is also given, calculated as if all components had 89% DS (the standard dry matter of compound feed).
- This value indicates the theoretical percentage of milk production from roughage.
- VEM forage milk indicates the fraction via offered energy from forage.
- DVE forage milk indicates the fraction via offered protein via forage.
- This is the ratio of the expected kg of FPCM to the total intake of feed in kilograms of dry matter.
- As a value for the expected kg of FPCM, we use with the minimum of the VEM and DVE expected FPCM.
- This value gives the cost (in EUR) of the ration.
- The value per kg DS is the net cost per kilogram of dry matter.
- The value TOTAL is the net cost of the total ration, i.e. depending on the amount of kilograms.
- Note: this value is only correct if correct feed prices are used.
- This value gives the theoretical feed cost (in EUR) for the production of 100 kilograms of expected FPCM. Here we use with the minimum of the VEM and DVE expected FPCM.
- Note: this value is only correct if correct feed prices are used.