Introduction
We recently launched our new application Farmdesk Climate, a specialized software tool that quantifies greenhouse gas emissions on dairy farms.
Increasing concentrations of greenhouse gases such as carbon dioxide (CO2), methane (CH4) and nitrous oxide (N2O) in the atmosphere are causing global warming. The dairy sector plays a prominent role and is best known for its methane emissions from enteric fermentation. Less discussed but also important are methane emissions from volatilization in manure, nitrous oxide emissions from fertilization and carbon dioxide emissions from fuel use and land use change.
About 70 to 90% of the carbon footprint of a dairy product, such as cheese or yogurt, originates from raw milk production on the farm [1]. About 75% of this raw milk footprint is related to feed and crop management, which in turn determines more than 50% of the total operating costs on a dairy farm.
Dairy processors around the world, including some in Flanders and the Netherlands, have declared their intention to reduce greenhouse gas emissions on dairy farms by 30% by 2030, with the additional goal of achieving net zero emissions by 2050 [2]. These ambitious plans will have a significant impact on dairy farm economic and technical performance.
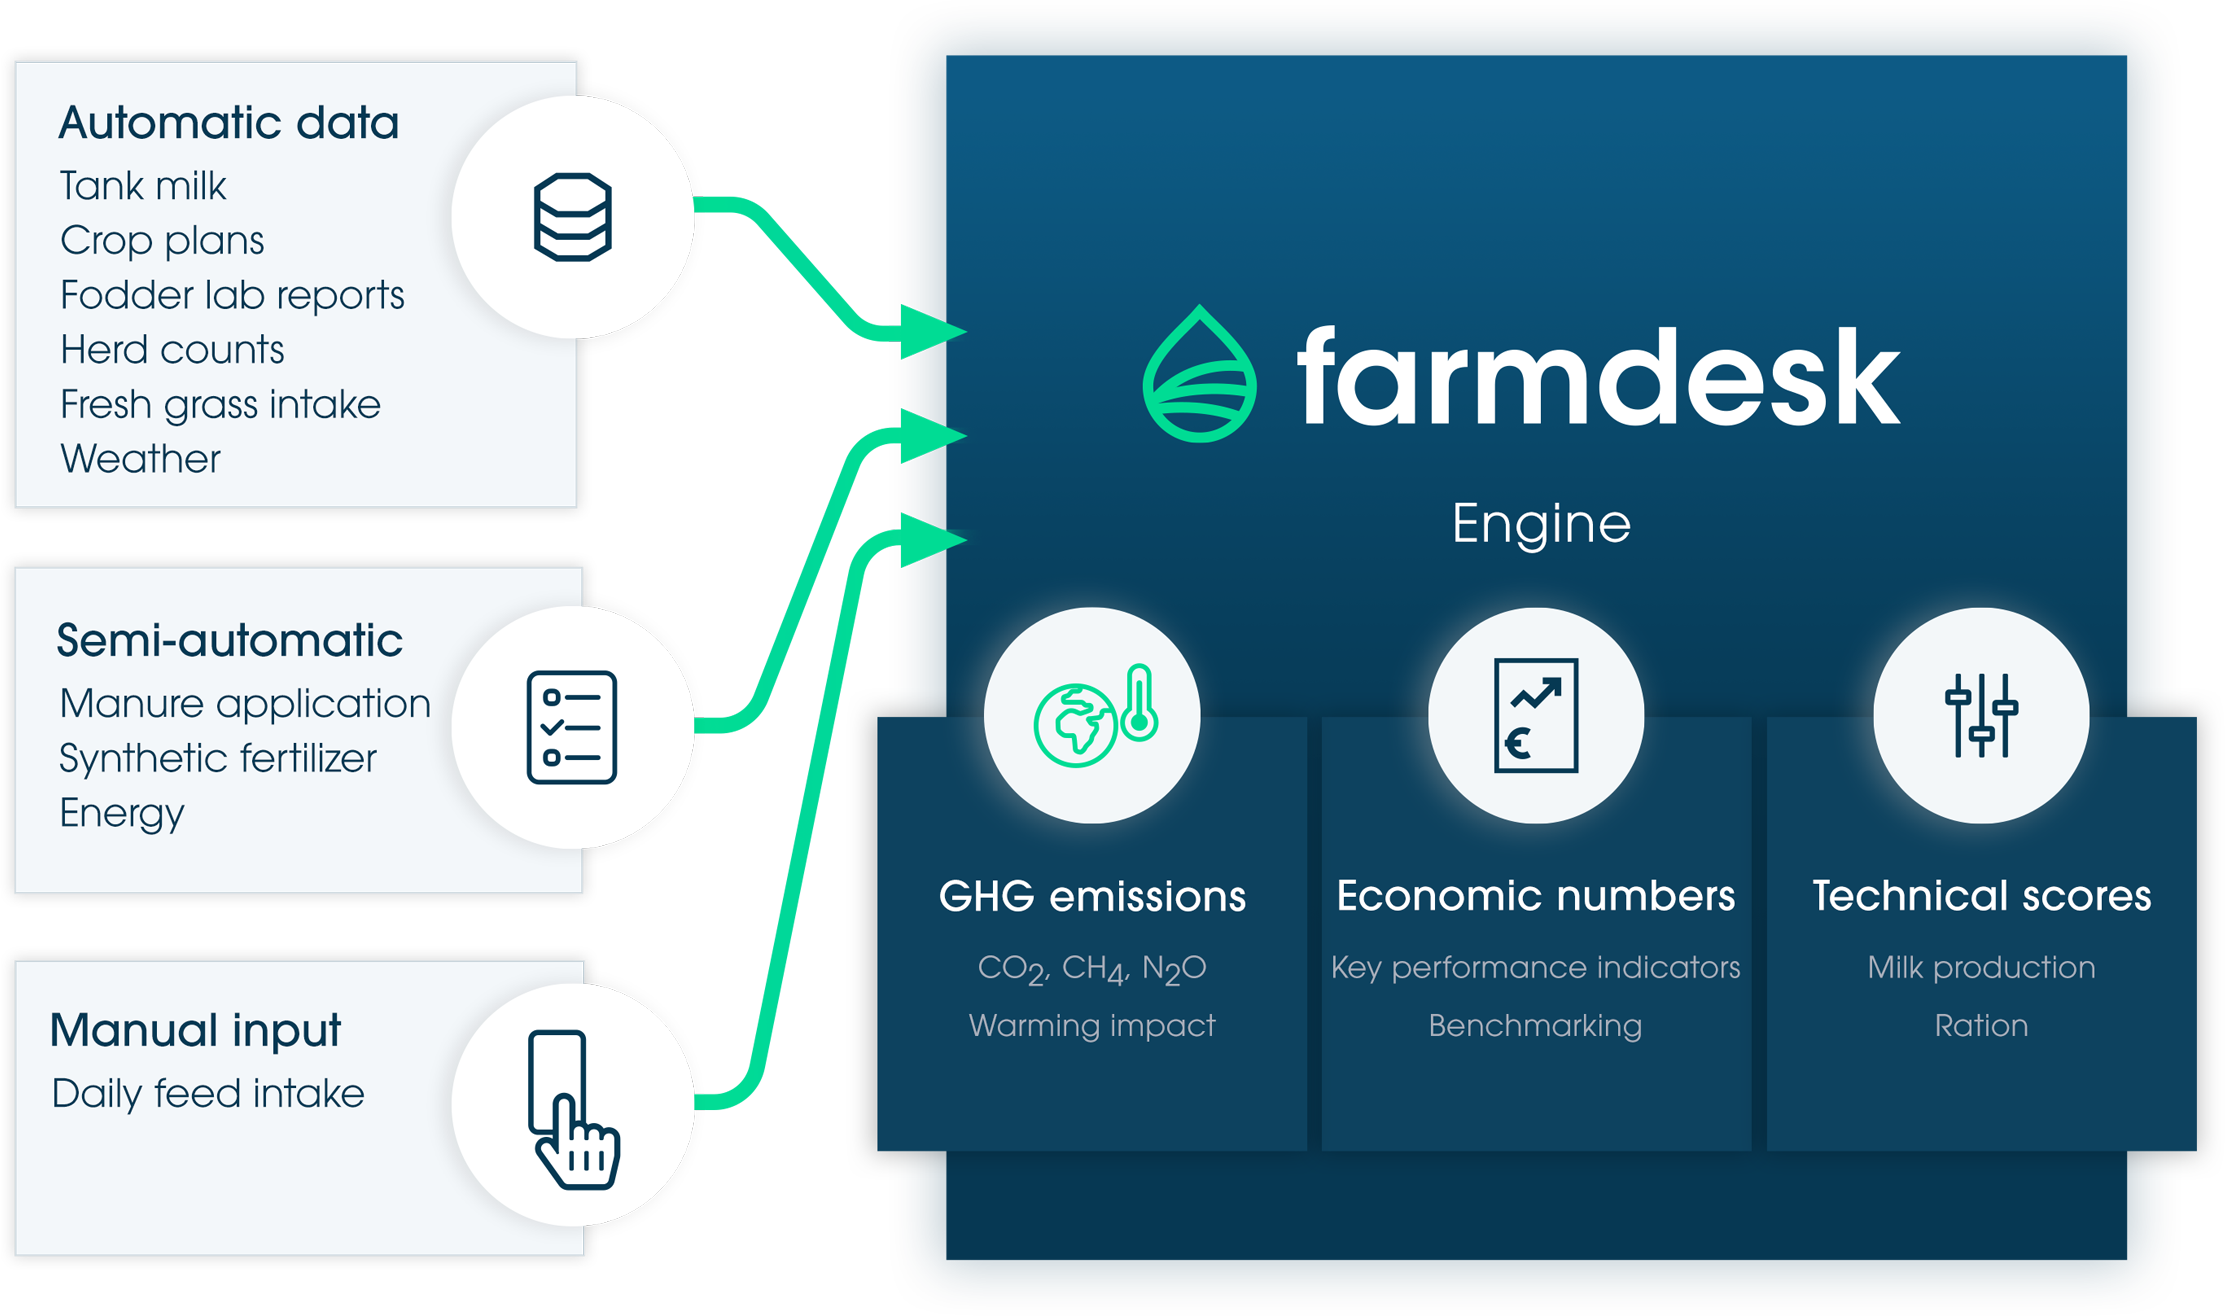
Farmdesk Climate addresses this challenge by positively stimulating dairy farmers along the way. Our solution is not an extra administrative burden, but adds value to dairy farmers by providing a smart feed assistant, insight into technical and economic performance indicators (KPIs), comparisons with other dairy farmers, and more. Data collection is automated whenever possible, which improves both accuracy and ease of use.

The farm interface provides an aggregated view of all participating dairy farms. Greenhouse gas emissions and other performance indicators are calculated and updated on a daily basis. Useful for dairy processors and other stakeholders (such as feed and seed companies, farm consultants...) to analyze and report emissions.
Methods
In this first publication, we present Farmdesk's 2023 research farm carbon footprint, calculated using the Farmdesk Climate tool.
Farmdesk's research farm is located in Flanders. A total milk volume of 896,152 liters was delivered to the dairy in 2023. Average milk production was 10,733 kilograms of standard milk (FPCM) per cow per year. An average of 79 cows per day were milked, in addition to 11 dry cows and 49 young cattle. The cropping plan consisted of 20.8 ha of grass without grazing, 20.5 ha of corn (of which 2.2 ha was harvested as ccm) with grass as a pre-crop and 2.2 ha of fodder beet. Maximum allowable livestock manure was applied to all fields, augmented by standard NP fertilization and liming. About 80% of the manure produced was liquid slurry stored in pits under the stables and in above-ground manure tanks. The remaining 20% was solid manure collected in straw beds that were regularly removed and stored in unsealed piles.
Feed intakes were collected via the Farmdesk app (which collects effective kilograms delivered from the feed mixer) with a minimum update frequency of once a week. Milk powder consumption of calves before weaning was entered by the farmer. Tank milk collections, cropping plans, animal numbers and feed lab reports were collected automatically through various data links.
A total of 42,000 kWh of electricity was consumed, of which 20,000 kWh was produced by solar panels on the farm. Crop-related diesel consumption (mainly for tractor work) was based on standard values from literature, as well as diesel consumption for feeding and other purposes on the farm.
Farmdesk Climate calculates daily greenhouse gas emissions cradle to farm gate. Individual emissions of the greenhouse gases methane (CH4), nitrous oxide (N2O) and carbon dioxide (CO2) are calculated according to applicable guidelines and standards (IDF global carbon footprint for the dairy sector; (IPCC 2019 Refinement to the) 2006 IPCC guidelines for National Greenhouse Gas Inventories Volume 4: Agriculture, Forestry and other land).
In this publication, all results are expressed in grams of CO2-equivalents per kilogram of standard milk (g CO2-eq/kg FPCM), using GWP factors of 27 for methane and 273 for nitrous oxide [3]. In accordance with IDF guidelines, an allocation factor for milk versus meat was calculated, resulting in a value of 87.2%.
Results & discussion
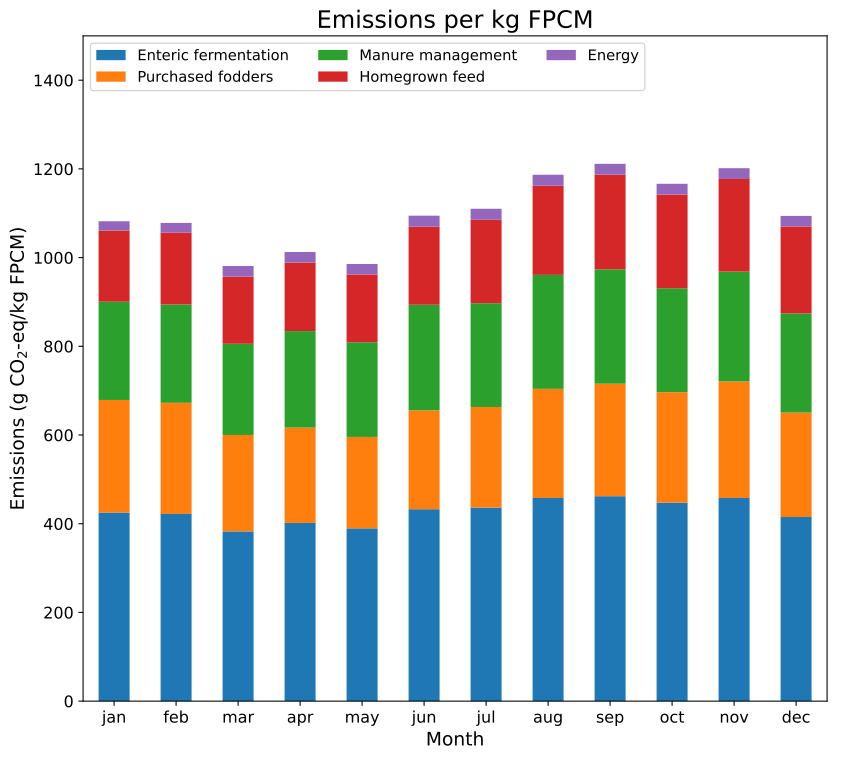
In the figure below, the top graph shows monthly emissions in g CO2-eq/kg FPCM. The inter-month variations are mainly caused by relative differences in milk production, as shown in the middle graph. In addition to the influence of milk yield, the monthly variations are also determined by changes in daily rations, which can be inferred from the variations of the segments of enteric fermentation, home-grown feed and purchased feed.
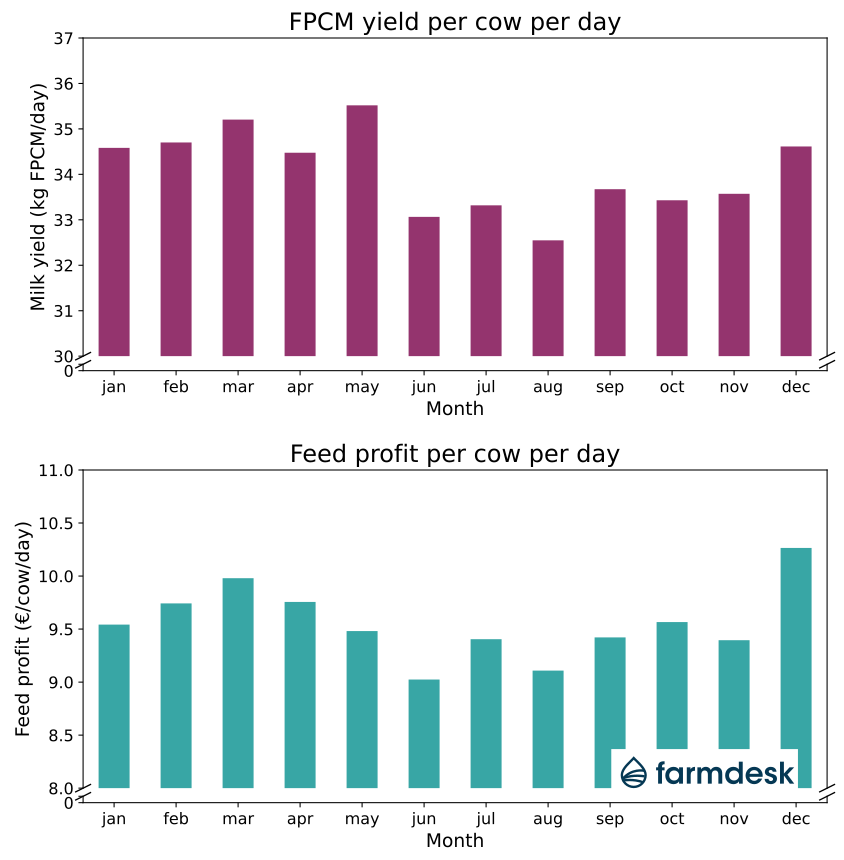
The bottom graph shows monthly feed profit expressed in €/cow/day. Feed profit is the main performance measure of farm profitability and depends on both milk price and feed costs.
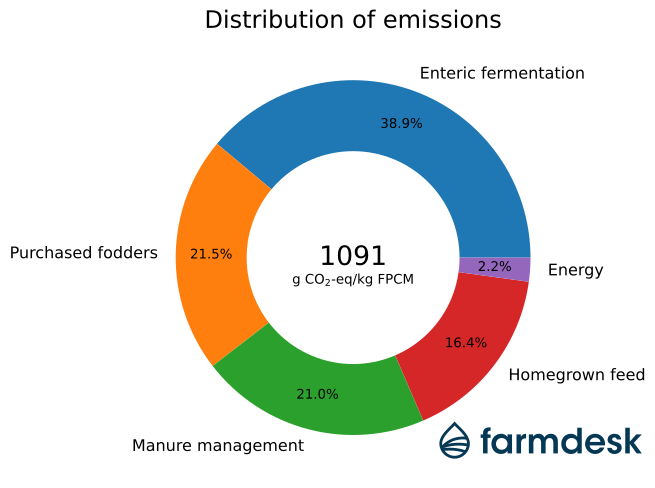
In the ring diagram below, emissions are divided into five main sources. Total greenhouse gas emissions over 2023 averaged 1091 g CO2-eq/kg FPCM. Enteric fermentation accounted for 425 g CO2-eq/kg FPCM (38.9%), followed by purchased feed with 235 g CO2-eq/kg FPCM (21.5%), manure management with 229 CO2-eq/kg FPCM (21.0%), homegrown feed with 178 CO2-eq/kg FPCM (16.4%) and energy consumption with 24.0 CO2-eq/kg FPCM (2.2%).
A more comprehensive breakdown of emissions is shown in the Sankey diagram below, which first breaks down the five emission sources into subcategories and then aggregates them into the various greenhouse gases.
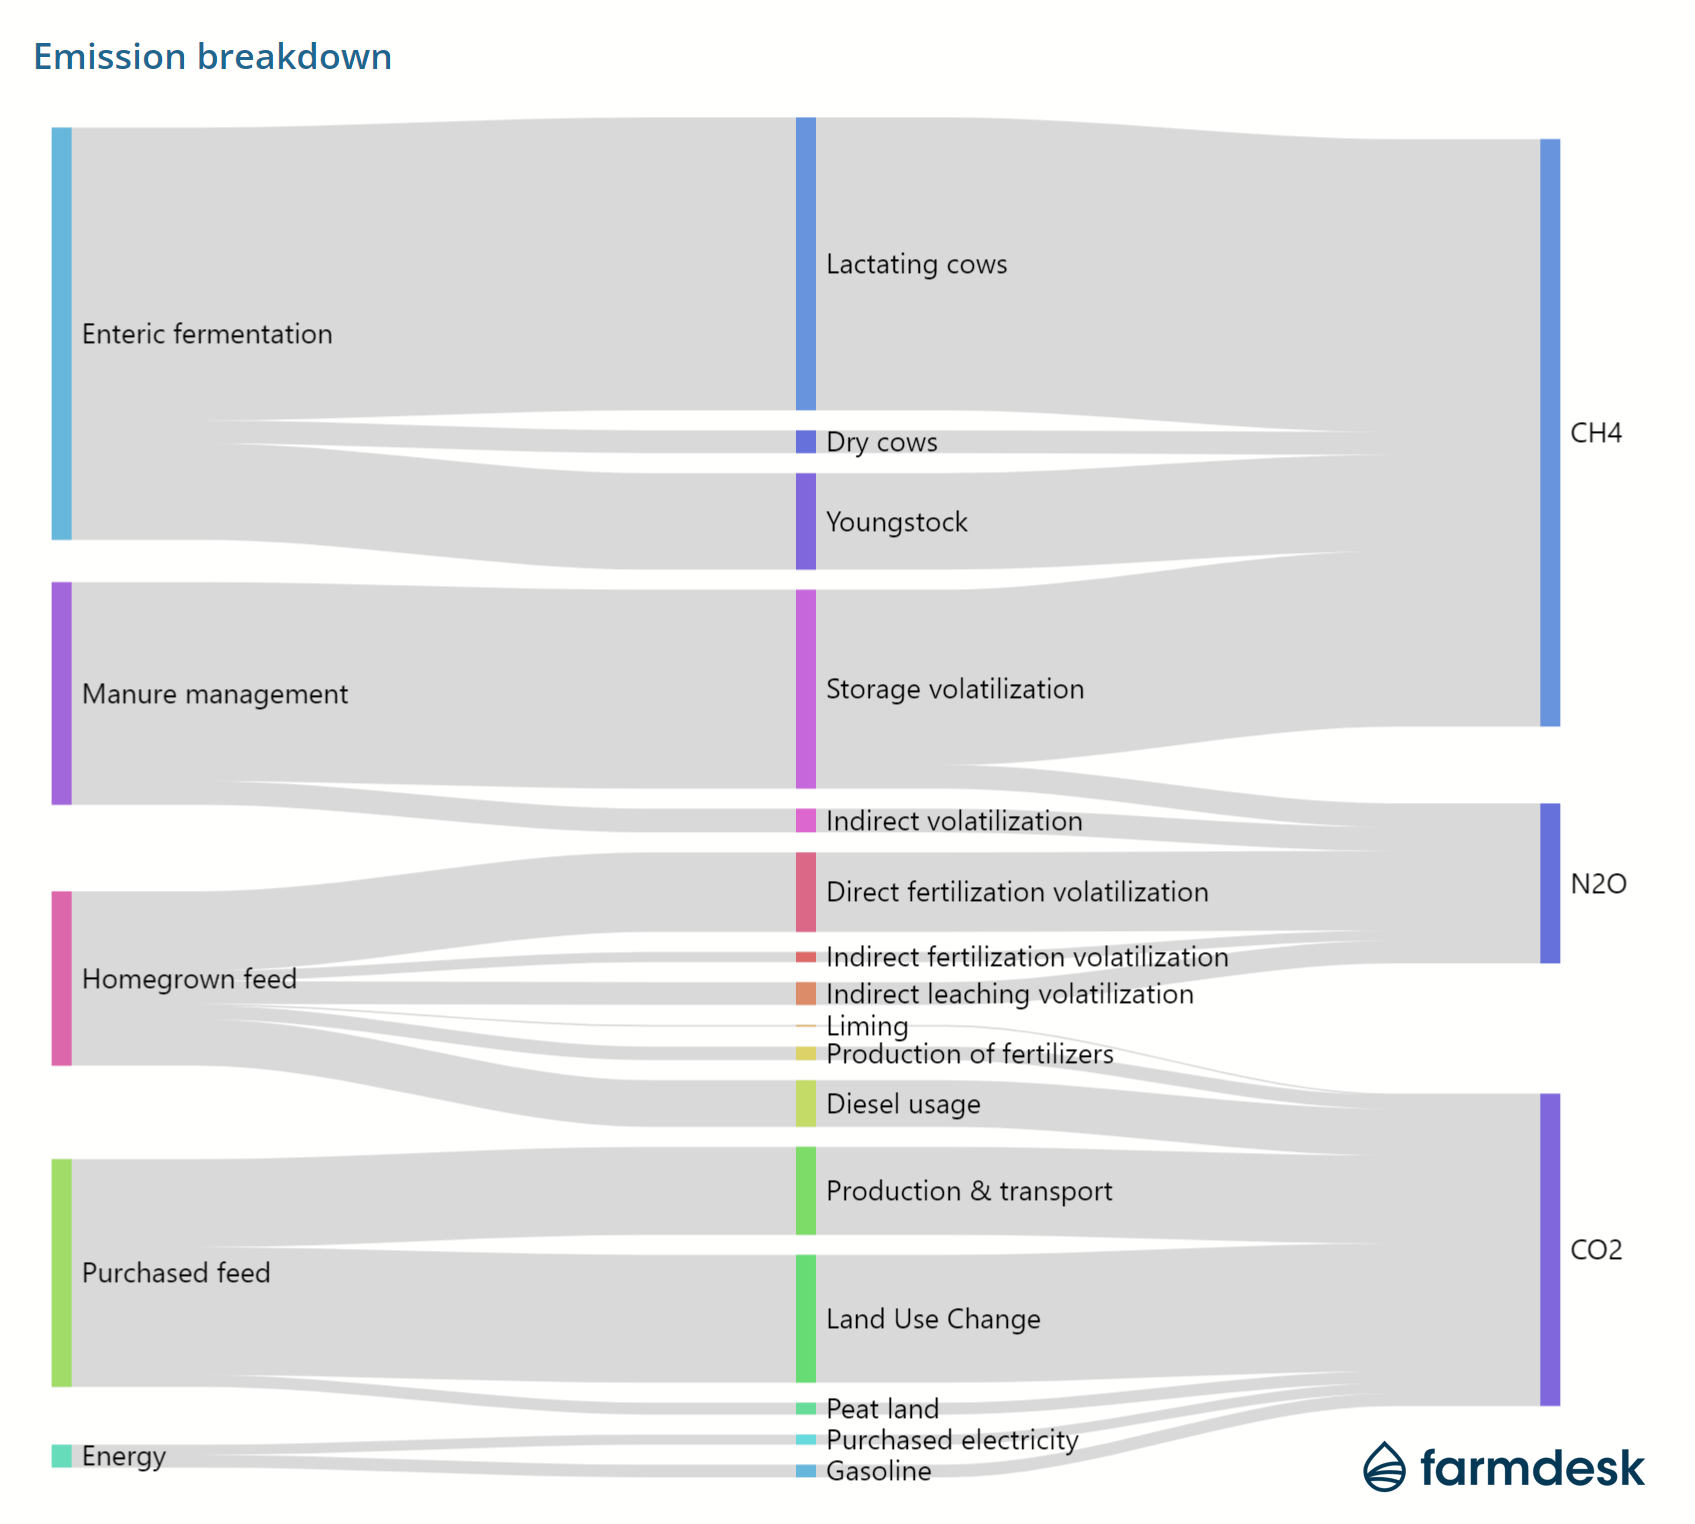
The subcategories with the greatest impact are enteric fermentation of lactating cows, volatilization from manure storage, and emissions related to feed purchases (including Land Use Change) and homegrown feed.
Reduction strategies with feed additives or manure treatment exist, however, they are difficult to implement or involve high costs. It is interesting to explore alternative strategies, such as increasing own feed production, reducing chemical fertilization, carbon sequestration or optimizing milk yield, along with their effect on profitability. This emphasizes the importance of measuring on-farm feed profitability (as shown above).
Conclusion
In this case study, the carbon footprint of a typical Flemish farm was calculated using the Farmdesk Climate tool. The result over all 12 months in 2023 was 1091 g CO2-eq/kg FPCM, with a minimum of 981 g CO2-eq/kg FPCM in March and a maximum of 1211 g CO2-eq/kg FPCM in September.
The dairy industry has set ambitious reduction targets by 2030. To achieve these goals, we firmly believe it is essential to encourage dairy farmers along the way and to monitor farm profitability and other key performance indicators in addition to carbon footprint calculations. Farmdesk Climate is an ideally suited tool for this purpose.
Our next publications will cover statistically relevant comparisons by conducting Farmdesk Climate on multiple farms, impact analyses of different mitigation strategies and the effect of different warming potential metrics such as GWP* [4].
References
[1] W. Finnegan, M. Yan, N. Holden, and J. Goggins, "A review of environmental life cycle assessment studies examining cheese production," Jilca, pp. 1773-1787, 2017.
[2] J. Marston, "Tracking corporate climate goals for meat & dairy is more crucial than ever." 2022. [Online]. Available: https://agfundernews.com/trarcking-corporate-climate-goals-for-meat-and-dairy-is-more-crucial-than-ever
[3] V. Masson-Delmotte et al., Climate Change 2021: The Physical Science Basis. Contribution of Working Group I to the Sixth Assessment Report of the Intergovernmental Panel on Climate Change. IPCC, 2021.
[4] J. Lynch, M. Cain, R. Pierrehumbert, and M. Allen, "Demonstrating GWP*: A means of reporting warming-equivalent emissions that captures the contrasting impacts of short- and long-lived climate pollutants," Environ. Res. Lett., vol. 15, no. 4, Apr. 2020.