Verifiable carbon footprint figures, ready for Scope 3 reporting to retailers and customers.
Reduction
From measuring to improving
Discover concrete reduction opportunities with the Footprint Optimizer and translate data into action.
Custom-made
Your brand, your approach
Fully tailored to your company, with its own branding and in line with its strategic vision.
The facts
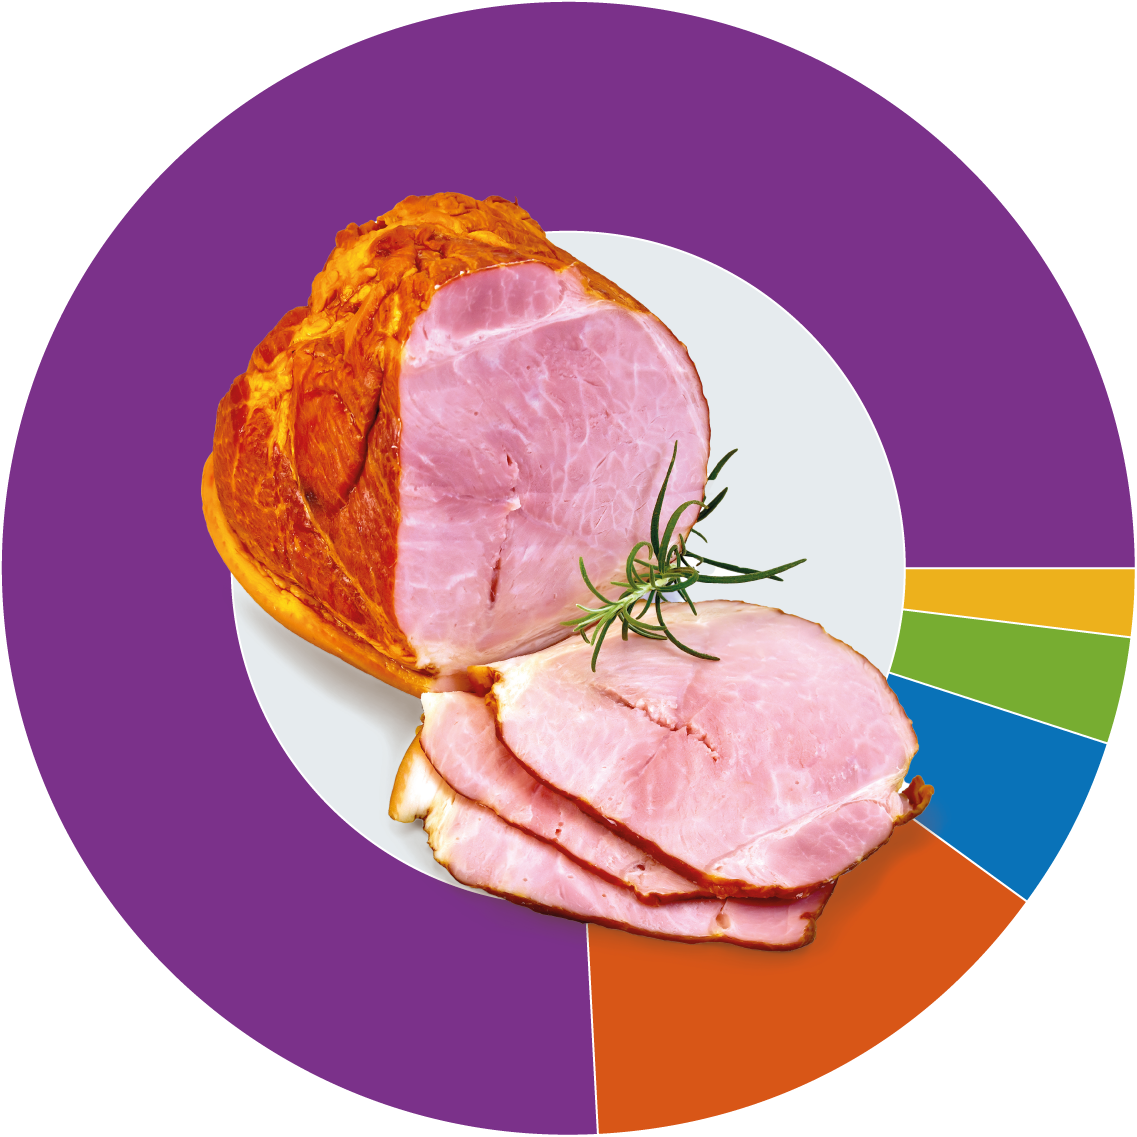
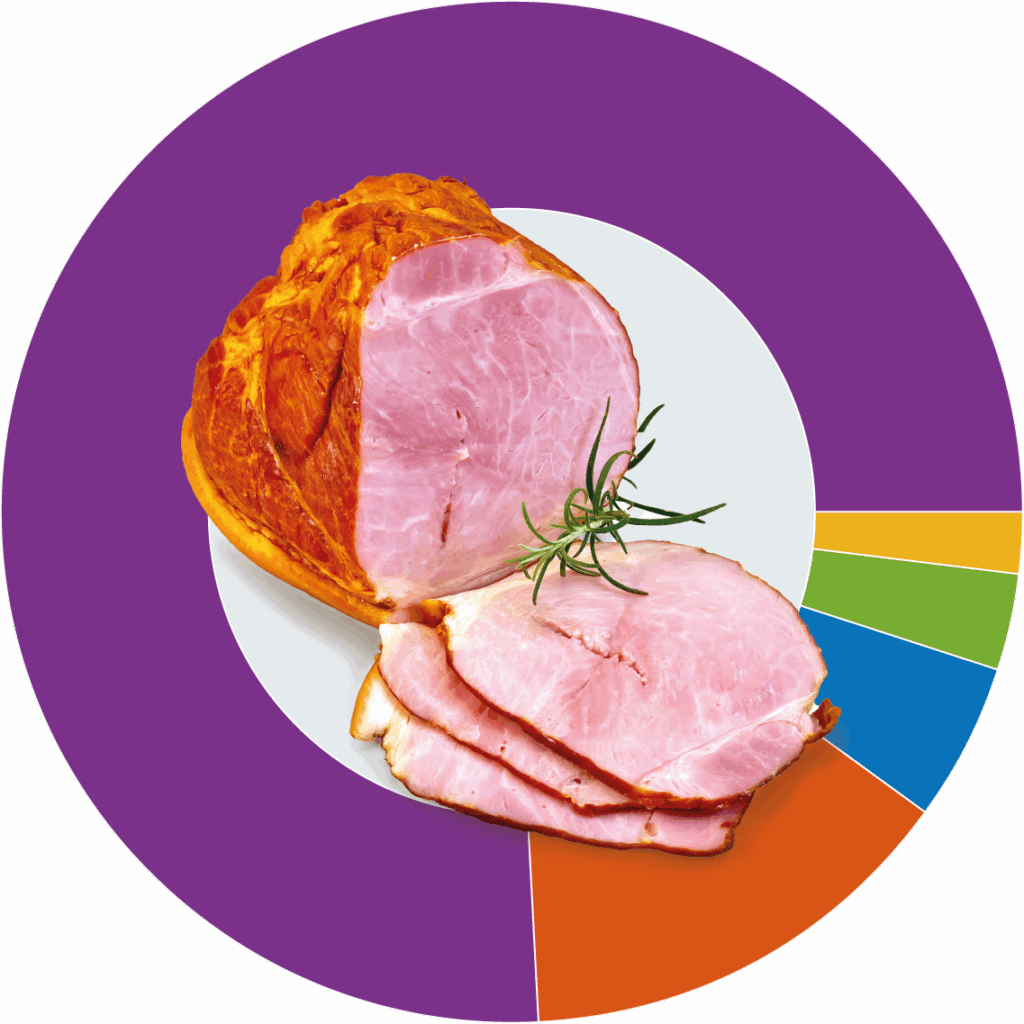
68 - 76 %
Feed
share of carbon footprint
Feed is the largest emitter
Purchased feed - grains and especially soy - dominate emissions.
14 - 25 %
Manure Management
share of carbon footprint
Manure Management is the second lever
Good or bad manure management makes the difference in emissions.
4 - 5 %
Enteric fermentation
share of carbon footprint
The proportion of enteric fermentation is small
This is clearly different from ruminants - methane is not the main player here.
*) Based on a closed pig farm with 250 sows and finishing (case study Farmdesk).
The case study
On a typical closed pig farm, we calculated three scenarios. The numbers show where the levers lie - from technical performance to the use of wet byproducts.
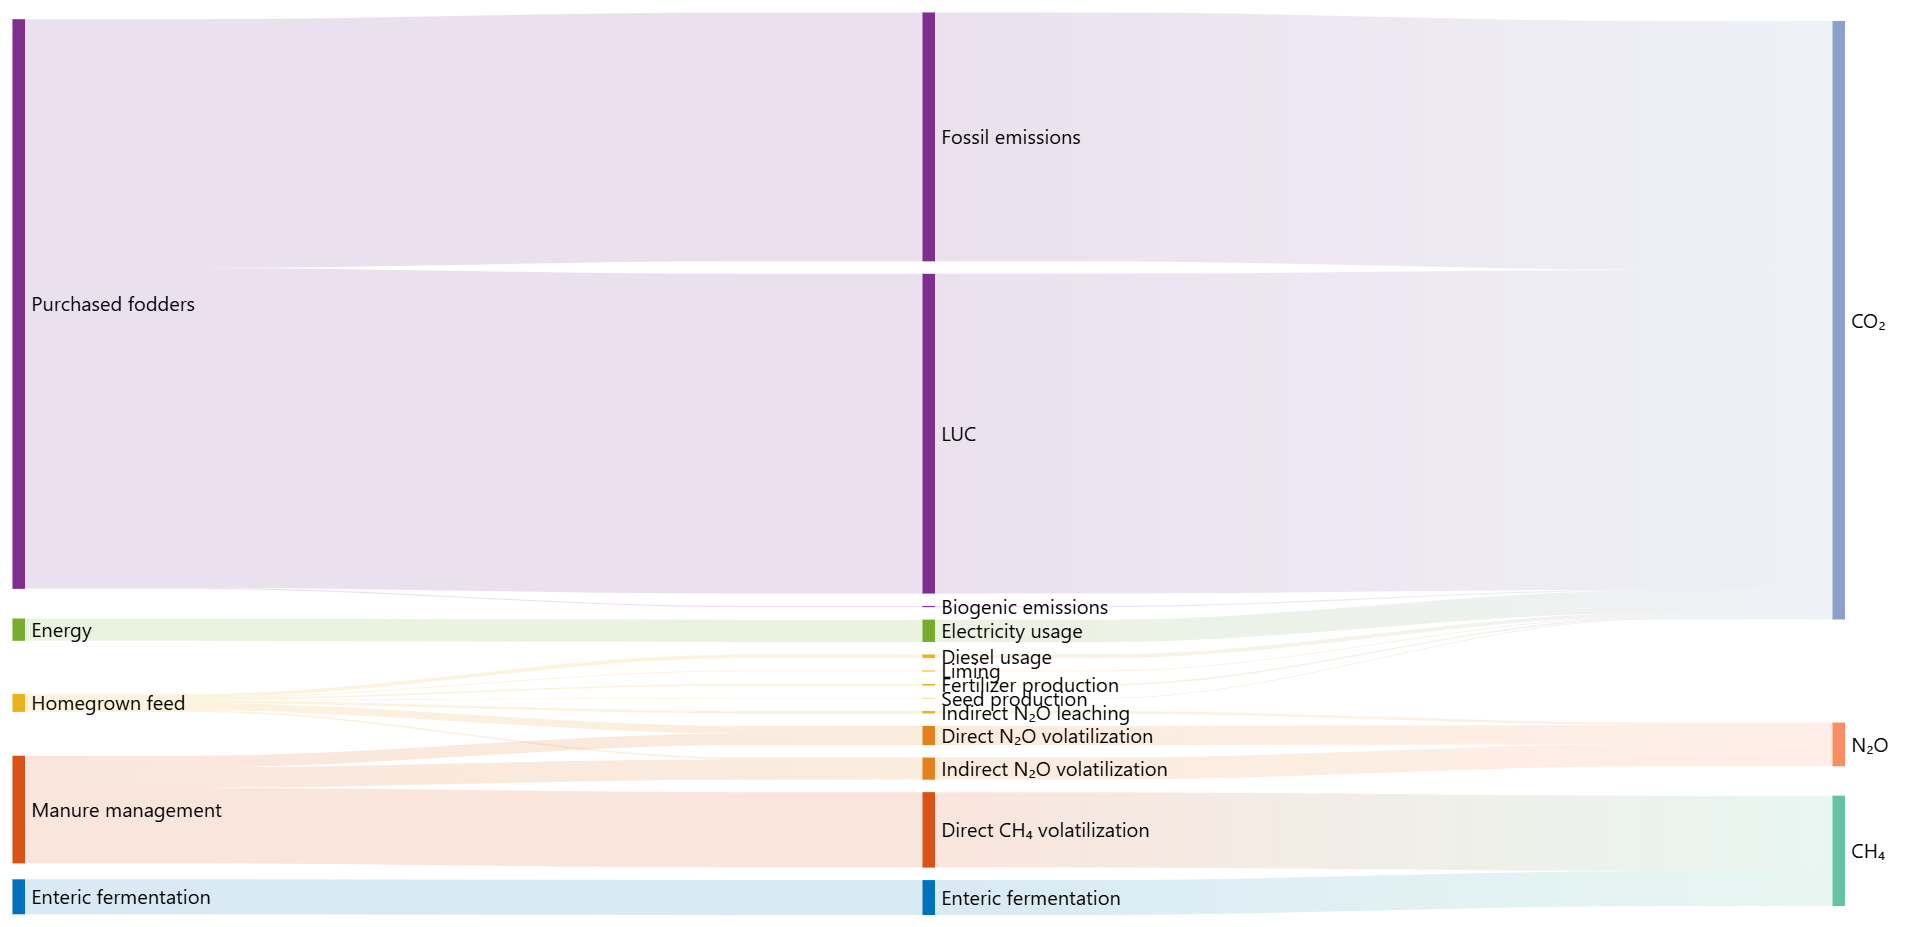
Greenhouse gas emissions are broken down by source and by animal category, expressed in g CO₂ equivalents per kg live weight. Calculated in accordance with IPCC guidelines.
Visualization from the case study — flows of inputs (feed, manure, energy) to greenhouse gases (CH₄, N₂O, CO₂) by animal category
Reduce emissions
The Footprint Optimizer in Farmdesk Climate | Pork suggests adjustments that reduce the footprint and improve the balance per head. Applicable at farm level for individual pig farmers, or at a global level to calculate scenarios for your entire supply chain.
Ration
Steer by protein source, soy share, wet by-products.
Own cultivation
Grow grain and/or CCM for your own farm.
Manure Management
Manage storage technique and timing of administration.
Energy
Optimize barn technology, ventilation and climate control.
Backed by science
Science-compliant
Our calculations and methodology reflect the IPCC's carbon footprint science.
Independently certified
Certified by Vinçotte for quantifying and reporting carbon footprints.