Introduction
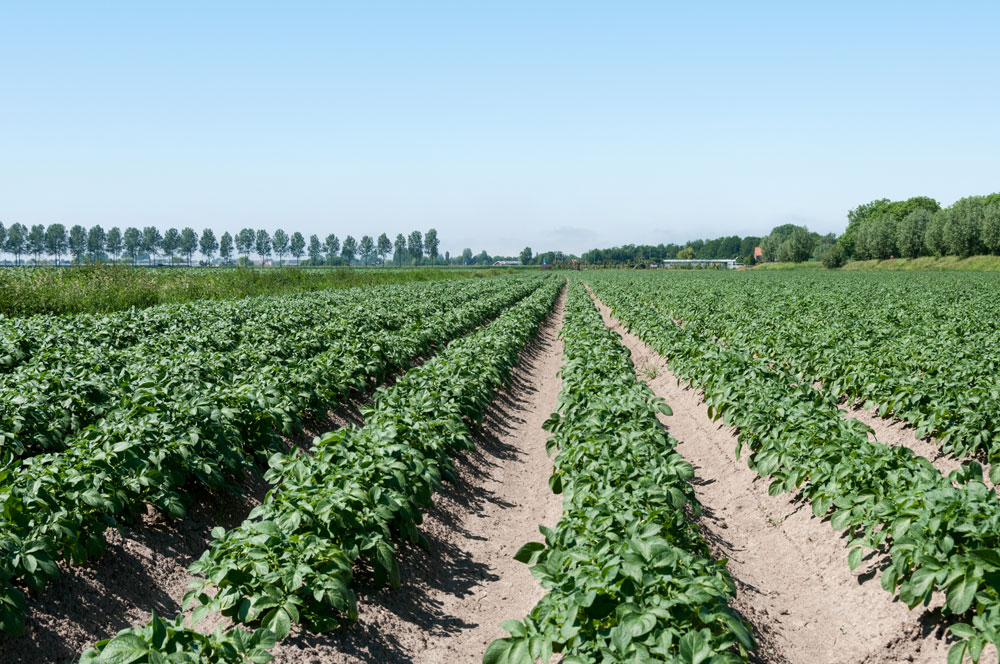
Following the successful development of Farmdesk Climate for the dairy -, and then the potato sector, we are now also presenting an expansion to the beef cattle sector. Of all agricultural sectors, beef cattle farming is likely to experience the greatest social pressure when it comes to climate impact.
In the European Union, the agricultural sector as a whole is responsible for approximately 11% of total greenhouse gas emissions (expressed in CO2-equivalents) [1]. Within agriculture, beef cattle farming and dairy farming make the largest contributions, each with a relative share of 29% [1].
While dairy processors worldwide have set up programs to reduce their footprint, it is striking that the beef cattle sector is lagging behind somewhat in this respect. This is probably due to a less consolidated processing sector and the lack of highly recognizable “brands” on store shelves.
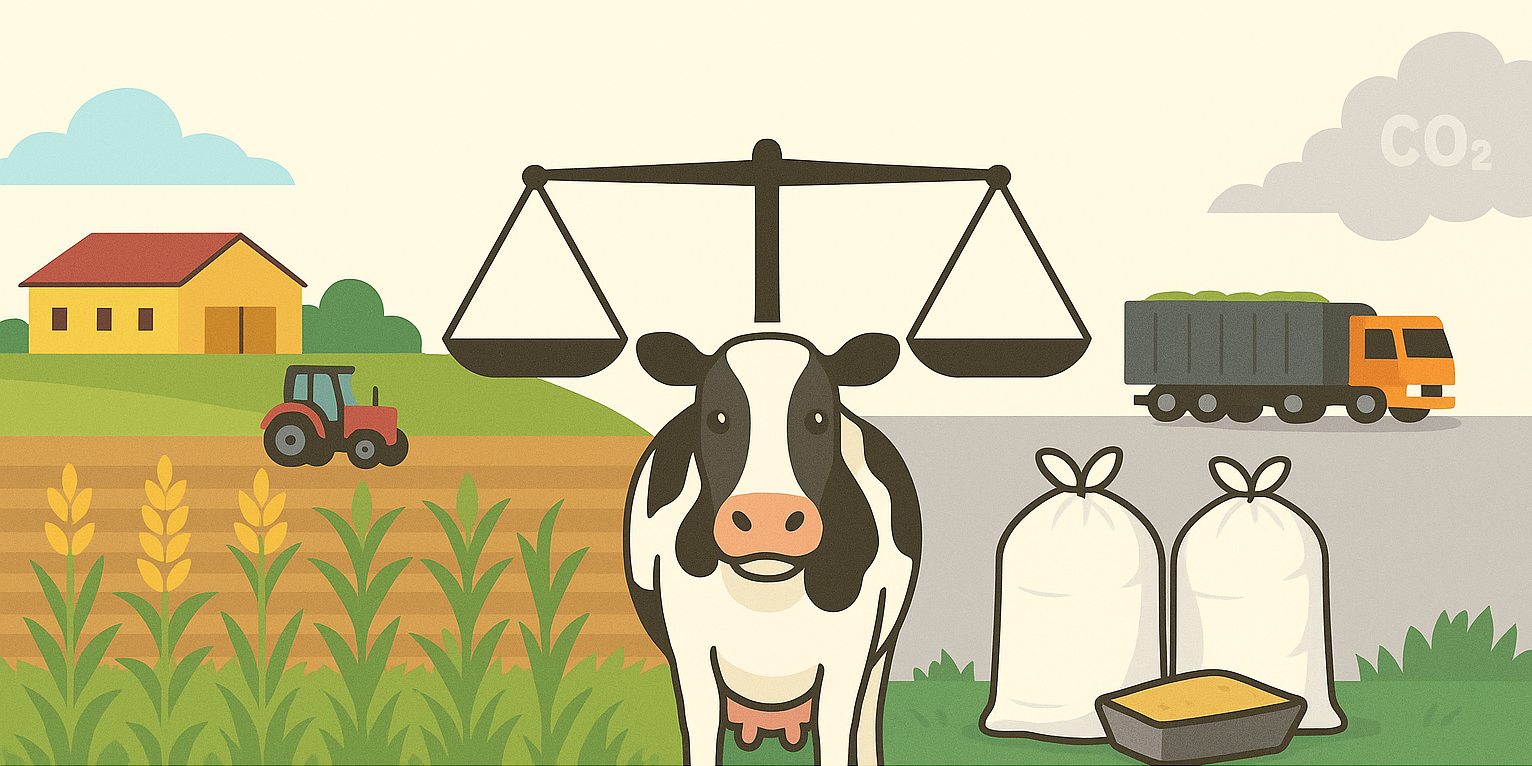
Three greenhouse gases are important in beef cattle farming: carbon dioxide (CO2), methane (CH2), and nitrous oxide (N2O). A major source of emissions is enteric fermentation: the process whereby microorganisms in the rumen of ruminants break down nutrients and release methane. In addition, nitrous oxide emissions occur on beef cattle farms during manure storage and fertilization of the land, and CO2 emissions occur during the use of fuels (mainly during field work) and during liming of the soil.
In order to obtain a complete picture of the carbon footprint, emissions from supply sources are also included (often referred to as “cradle to farm gate”). This mainly concerns the production of purchased concentrated feed (including CO₂ emissions from land use change, such as deforestation for soy cultivation) and the production of fertilizers.
In the rest of this article, we present the carbon footprint calculation for a Flemish beef cattle farm with Belgian Blue cattle for the year 2024. The emissions of CO₂, CH₄, and N₂O were calculated separately and then aggregated into a single indicator: the CO₂-equivalent (CO₂-eq). To do this, methane and nitrous oxide emissions are multiplied by their respective GWP100 factor (“Global Warming Potential”), which indicates how much heat these gases retain over a period of 100 years compared to CO₂. Biogenic methane has a GWP100 factor of 27.0, while nitrous oxide has a factor of no less than 273.0 [2]. An important side note here is the biogenic and short-lived nature of methane. More information on this can be found in the section “What about methane?” further on in this article.
The total greenhouse gas emissions in 2024, expressed in CO2-eq, were finally divided by the total live weight that left the company. This gives a carbon footprint of kg CO2-eq/kg live weight (LW). In addition to the example company, an alternative (hypothetical) scenario was also calculated, with more land-based operations and the use of deforestation-free feed. The impact on the operating balance was also taken into account.
Case farm
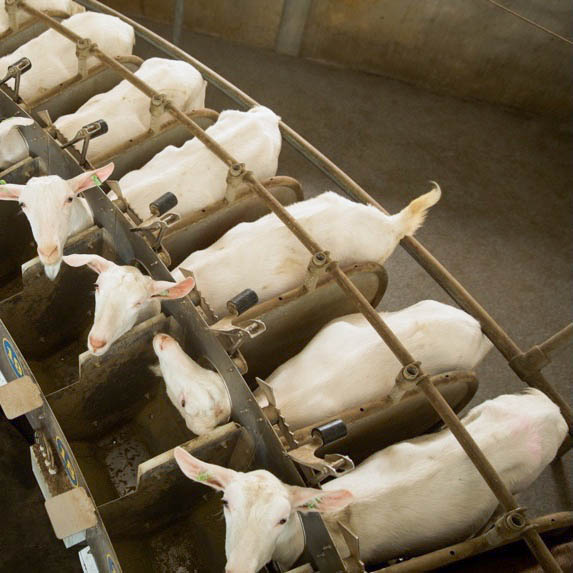
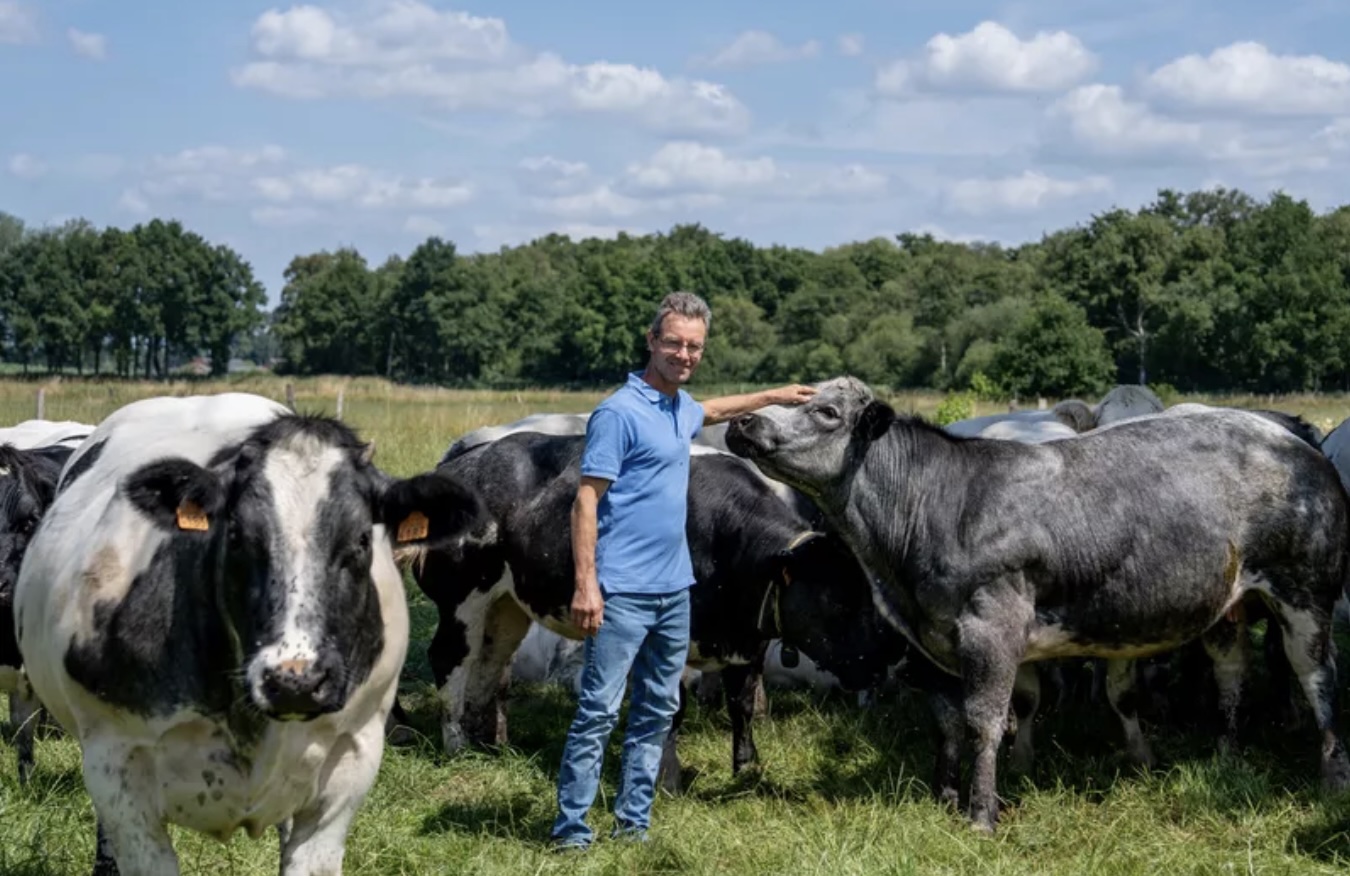
Yves Gericke and his wife Sylvia Luyckx run the Vloeikenshoeve, a beef cattle farm with around 200 Belgian Blue cattle. The farm is located in a rural area in Wuustwezel, in northern Belgium. It is a fully closed farm where both bulls and cows are kept and fattened. The cows graze on permanent pasture for more than seven months of the year. Yves and Sylvia strive for maximum self-sufficiency in both roughage and concentrated feed.
Data on livestock was automatically imported via a Sanitel link. The cultivation plan was also automatically retrieved by importing the crop plan ("verzamelaanvraag"). In 2024, this covered a total area of 55 ha, consisting of grassland (20.5 ha), grass clover (14 ha), silage maize (10 ha), grain maize (1.3 ha as CCM), fodder beet (1.1 ha), rye (4.6 ha), spelt (2 ha), and winter barley (1.5 ha). The aim is to achieve two crops per year, which is easily achievable thanks to the use of various intermediate crops (including grass and silage rye).
The calculations distinguished between rations for nine animal groups: calves up to 90 days old, calves up to 180 days, bull calves up to 12 months, female calves up to 12 months, bull calves up to 15 months, fattening bulls, suckler cows up to 26.7 months, suckler cows up to 41 months, and fattening suckler cows.
The ration for the youngest calves up to 180 days consisted of grass hay, silage maize, barley, soybean meal, spelt, and minerals. In the rearing phase up to 15 months, grass hay was replaced by grass silage, spelt by rye and CCM (only for male animals), and beet pulp was provided as a supplement. Female breeding cattle from 12 months of age grazed outdoors, with pregnant heifers also being fed silage maize. Finally, in the finishing phase for both bulls and cows (100 days on average), linseed flakes were added to the feed.
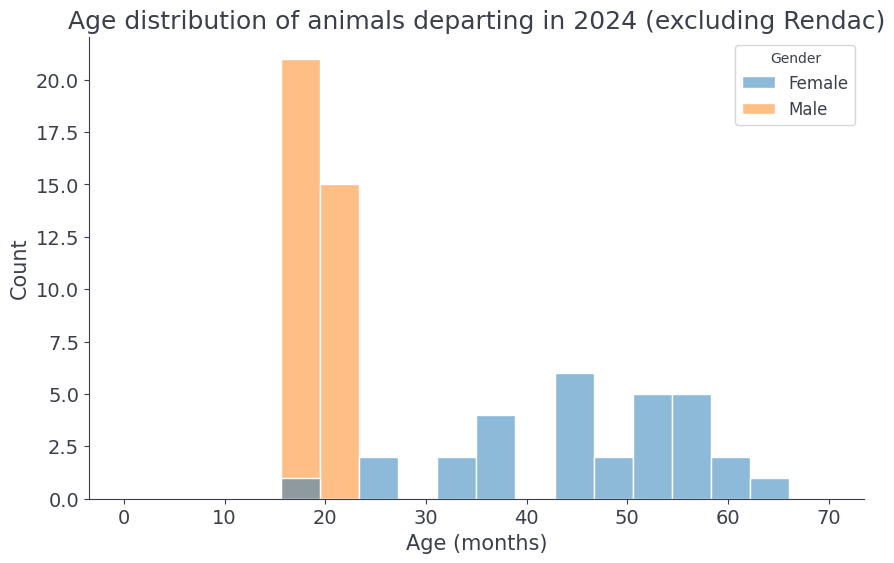
In 2024, a total of 36 bulls and 30 suckler cows were sent to the slaughterhouse, with an average live weight of 720 kg and 848 kg respectively. The average slaughter age of the bulls was around 20 months. Among suckler cows, there was a greater spread, depending on the number of times a cow had calved. The average age of suckler cows at slaughter was 46 months, with variations between 35 and 60 months.
Results and discussion
Case farm
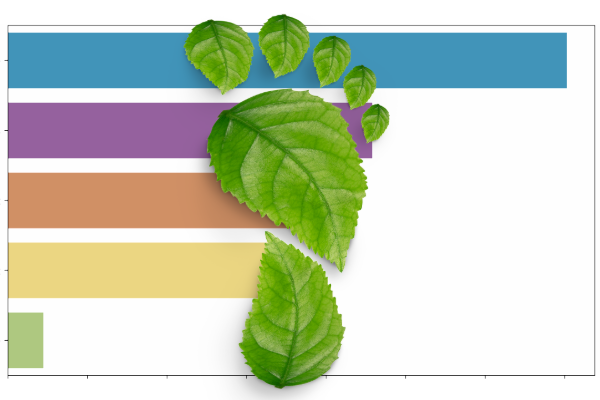
The case farm had total emissions of 16.2 kg CO2-eq per kg of live weight leaving the company in 2024. Enteric fermentation accounted for 7.4 kg CO2-eq/kg LW (45%), followed by manure management with 3.4 kg CO2-eq/kg LW (21%), homegrown feed with 2.9 kg CO2-eq/kg LW (18%), purchased feed with 2.2 kg CO2-eq/kg LW (14%) and energy consumption with 0.3 kg CO2-eq/kg LW (2%).
The flow chart below links the emission sources to the various greenhouse gases via subcategories. Virtually all methane emissions originate from enteric fermentation. Methane emissions from manure storage remain very limited due to the use of a deep litter system. This system has more aerobic conditions than a slurry tank, resulting in less methane being formed than on typical dairy farms (see also our previous publication).
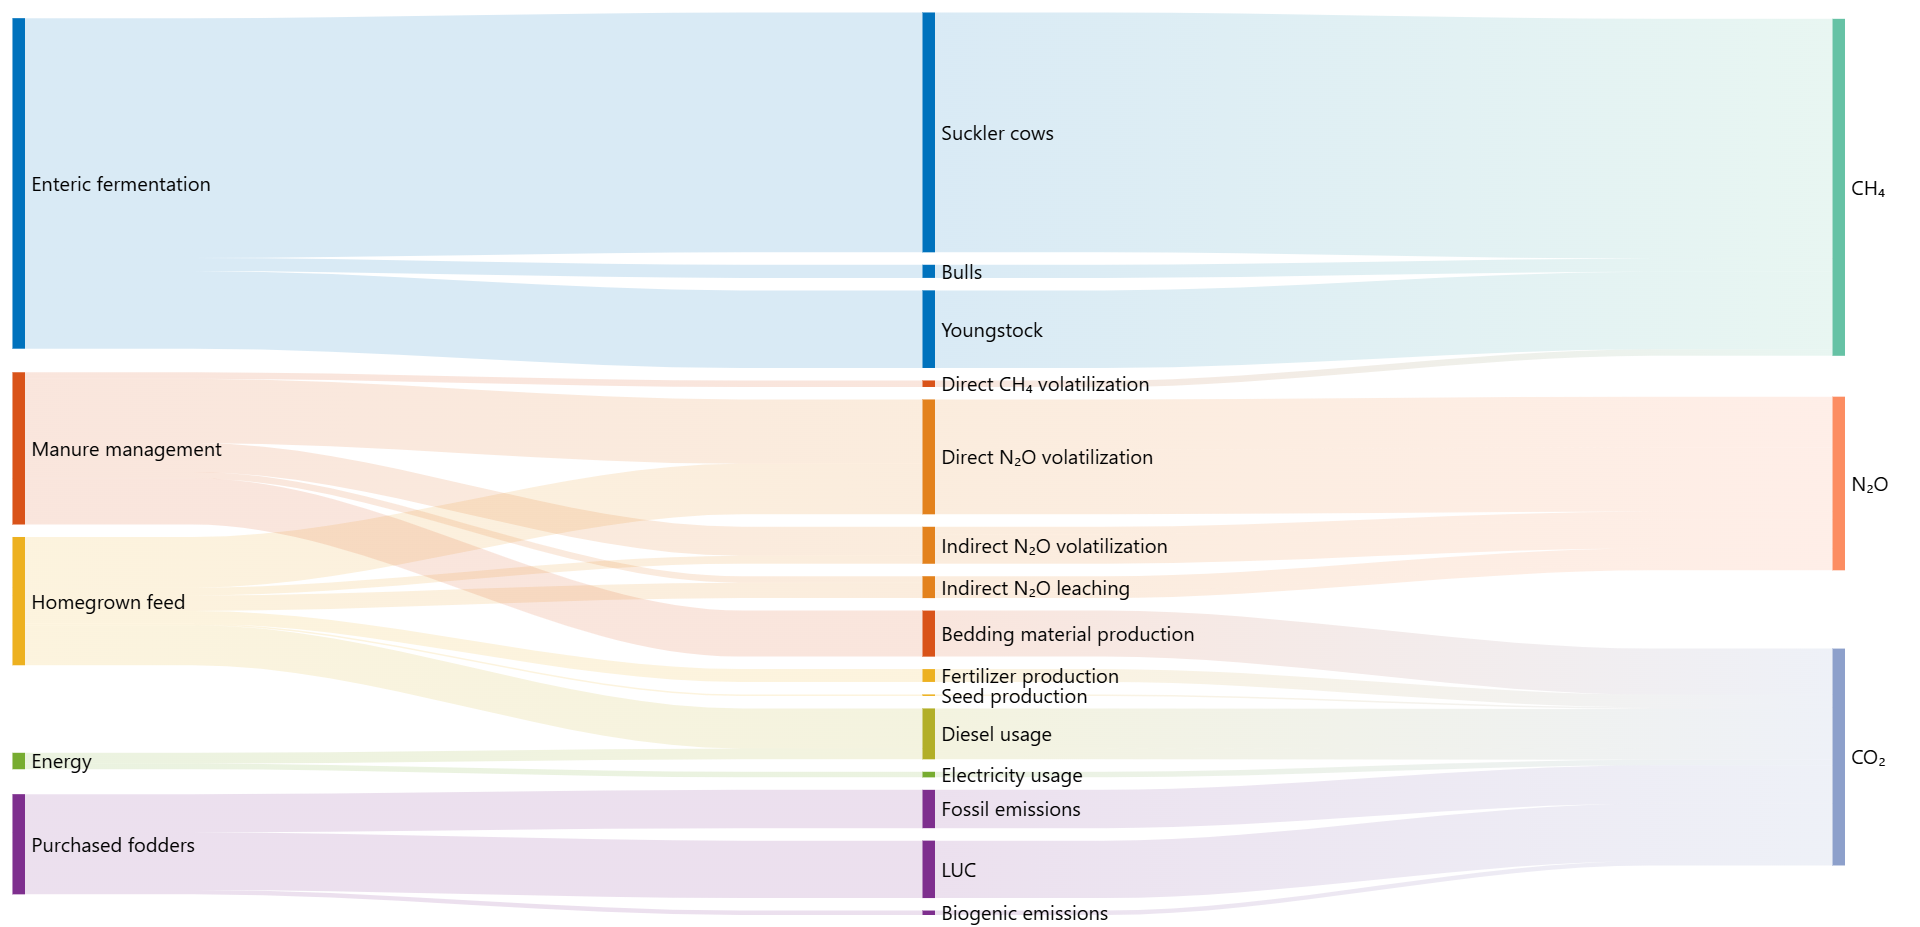
Within manure management, nitrous oxide emissions arise due to volatilization, and CO2 emissions are also attributed to the production of straw used as bedding. The category of homegrown feed includes nitrous oxide emissions resulting from the use of (artificial) fertilizers and CO2 emissions from the use of fuels during agricultural work. For purchased feed, CO2 emissions resulting from land use changes (such as deforestation, mainly for the production of soybean meal) and from the use of fossil fuels are included.
The graph below shows the contribution of an average animal within a specific ration group, with emissions added up over a full year. The increase in emissions with increasing age is striking. This is the result of increasing feed intensity as the cattle get older, with the final fattening phase having a particularly large impact.
Alternative scenario
In addition to the case farm, an alternative (hypothetical) scenario was calculated that is even more land-based. In the cultivation plan, the 4.6 ha of rye was replaced by a mixed crop of triticale and field beans. This crop does not require nitrogen-containing fertilizer, because the field beans themselves fix nitrogen as legumes. Clover fulfills this role in grassland, which means that fertilizer can also be avoided there and the protein content remains at the required level.
In addition, the protein supply from outside the farm can be reduced, as field beans are rich in both starch and protein. As a result, the proportion of soybean meal in the rations was halved and replaced with rapeseed meal. By integrating sunflowers into the corn, the fat content of the silage corn can also be increased, ensuring that sufficient fat is still available during the finishing phase with relatively less linseed meal. In short, technical performance is maintained by using flowering and functional crops. This also increases biodiversity and can brighten up the landscape, which can have a positive impact on the well-being of both farmers and society.
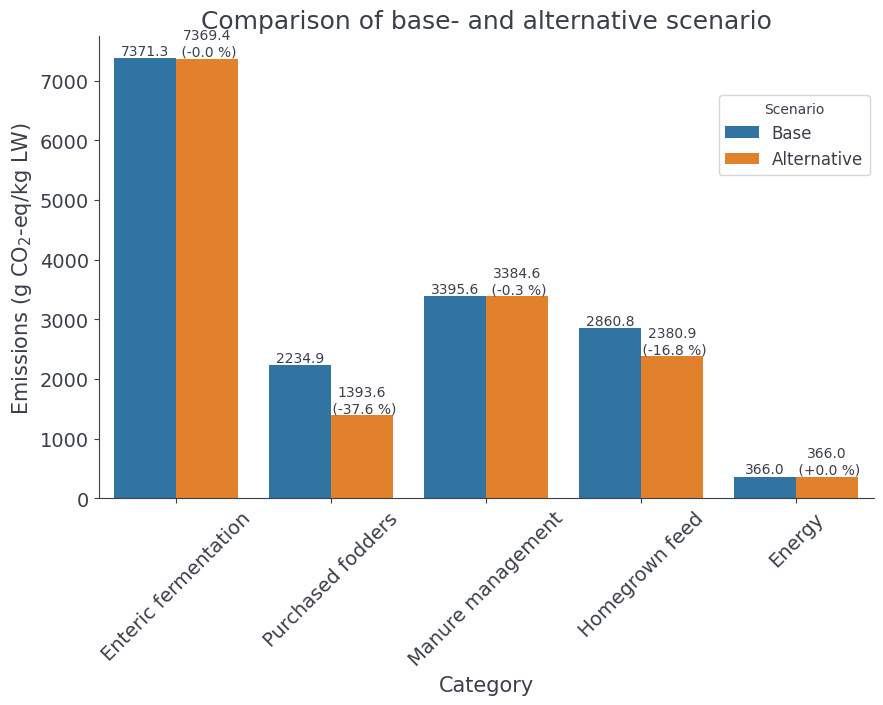
The alternative scenario results in emissions of 14.9 kg CO2-eq/kg LW, a decrease of 8.2% compared to the case farm (16.2 kg CO2-eq/kg LW). Further reductions may be achievable, for example by completely omitting soybean meal from deforested areas. If the soybean meal is partially replaced by brewers' grains (a by-product with a low CO2 footprint), the carbon footprint will decrease even further. More economical use of nitrogen in manure, for example by incorporating zeolites into feed or bedding, can also reduce ammonia emissions and thus reduce nitrous oxide production.
Halving the proportion of soybean meal and replacing it with rapeseed meal results in a 38% reduction in the category of purchased feed. In addition, the category of own-grown feed decreases by 17% due to reduced fertilizer use on grassland and the introduction of mixed cultivation of triticale with field beans.
The total feed costs (purchased and homegrown feed) for the case farm amounted to €123,565, compared to €119,164 for the alternative scenario. In addition to an 8.2% reduction in greenhouse gas emissions, this scenario also results in an increase in the operating profit of €4,400.
Comparison with literature
A climate scan was also conducted at the Vloeikenshoeve farm for 2023 using DECiDE, a tool developed by the Walloon Agricultural Research Center (CRA-W) [3]. The score (excluding carbon sequestration in the soil) was 16.6 kg CO2-eq/kg live weight (LW), which is close to our calculation of 16.2 kg CO2-eq/kg LW for 2024. The same report gives a median for the Belgian sector of 18.7 kg CO₂ eq/kg LW. A 2019 study by UCLouvain gives a footprint for the Belgian Blue sector of between 15.0 and 20.5 kg CO2-eq/kg LW [4].
It is also interesting to make international comparisons, although this is difficult due to differences in methodologies: functional units vary (per kg live weight or per kg carcass weight), parameters and calculation models change over time (such as the GWP100 conversion factors), and system boundaries differ (e.g., whether or not to include carbon storage in the soil).
A 2019 literature review compared 22 scientific papers on various cattle breeds worldwide. After harmonizing the calculations, the footprint ranged between 10.0 and 32.4 kg CO2-eq/kg LW, with an average of 16.8 kg CO2-eq/kg LW [5]. Our example farm, with a footprint of 16.2 kg CO2-eq/kg LW, therefore scores relatively well compared to the rest of the world, and with a few interventions, it could score even better.
What about methane?
When CO2 (from fossil fuels) and nitrous oxide are emitted, these greenhouse gases accumulate in the atmosphere and remain there for hundreds of years. As long as emissions of these gases continue, global temperatures will continue to rise. This means that net emissions of CO2 and nitrous oxide must ultimately be reduced to zero in order to halt further warming.
Methane has a fundamentally different character. It is largely broken down in the atmosphere within approximately 12.5 years into CO2, which, with a stable livestock population, is recaptured by plants and absorbed by livestock as roughage. This closes the biogenic cycle and means that constant methane emissions do not lead to a continuous accumulation of greenhouse gases, unlike CO2 and nitrous oxide.
This distinction is insufficiently reflected in the GWP100 (Global Warming Potential over 100 years) metric. This implicitly treats methane as a “stacking” gas, which means that with constant or declining methane emissions, its actual contribution to global warming is overestimated. At the same time, rising methane emissions actually underestimate global warming. Although GWP100 is recommended by the IPCC and widely used, this metric has clear limitations for assessing short-lived methane [6].
Study [5] therefore also used an alternative indicator: GTP100 (Global Temperature Potential), which more directly reflects the contribution of emissions to temperature change after 100 years. This measure is more in line with the short-lived and biogenic nature of methane from livestock farming. Applied to the systems studied, this resulted in an average footprint of 5.99 kg CO2-eq/kg LW, which is 64% lower than calculated with GWP100.
In addition, the same study also compared intensive production systems with a high proportion of concentrated feed (feedlot systems) with extensive, grass-fed systems. Under GWP100, grass-fed systems generally have a higher climate footprint, mainly due to higher methane emissions resulting from the digestion of crude fiber. However, when GTP100 is applied, the footprint of extensive systems often turns out to be lower [5].
Conclusion
This article presents the expansion of Farmdesk Climate to the beef cattle sector based on a case study at the Vloeikenshoeve, a beef cattle farm with Belgian Blue cattle in Wuustwezel (Belgium). The analysis for 2024 shows that the example farm has a carbon footprint of 16.2 kg CO2-equivalent per kilogram of live weight. Compared to other farms in the sector, this is a relatively low footprint.
In an alternative (hypothetical) scenario, in which rye was replaced by a triticale-field bean mixed crop and the proportion of soybean meal in the feed ration was halved in favor of rapeseed meal, the footprint decreased by 8.2%. At the same time, the operating profit would increase by €4,400 thanks to lower feed costs.
“Farmdesk Climate proves to be an efficient tool for investigating both the climate impact and the technical and economic feasibility of reduction strategies. This is essential if the beef cattle sector is to maintain its social and economic position within a sustainable food system in the future.”
Jef Aernouts
Methane emissions from livestock farming require special attention due to their fundamentally different behavior compared to CO2 and nitrous oxide. Reducing methane emissions can contribute to limiting global warming in the short term, but should not be a substitute for CO2 reductions, which remain essential in the long term. For a careful assessment of climate impacts, it is desirable to interpret emissions of individual greenhouse gases separately. Farmdesk will explore this further in follow-up research.
References
- Leip, A., Weiss, F., Wassenaar, T., Perez, I., Fellmann, T., Loudjani, P., Tubiello, F., Grandgirard, D., Monni, S., & Biala, K. (2010). Evaluation of the livestock sector’s contribution to the EU greenhouse gas emissions.
- IPCC Assessment Report 6 (2024), https://www.ipcc.ch/report/ar6/wg1/chapter/chapter-7/ section 7.6.1.1
- https://decide.cra.wallonie.be/
- Riera, A., Antier, C., & Baret, P. (2019). Study on Livestock scenarios for Belgium in 2050. UCLouvain
- Lynch, J. (2019). Availability of disaggregated greenhouse gas emissions from beef cattle production: A systematic review. In Environmental Impact Assessment Review (Vol. 76, pp. 69–78).
- Pierrehumbert, R. T., & Eshel, G. (2015). Climate impact of beef: An analysis considering multiple time scales and production methods without use of global warming potentials. Environmental Research Letters, 10(8).